Changing the Secondary Transfer Voltage
When image blurring occurs on the custom paper type more obviously than standard paper types, you can adjust the Secondary Transfer Voltage (the voltage that transfers toner to the paper).
 |
Adjusting the Secondary Transfer Voltage may affect the settings in <Adj. Lead Edge Sec. Transfer Volt.>, <Correct Tail End Toner Application> and <Adjust Image Position>. Readjust these settings, if necessary. |
Specifying/Outputting Chart Prints
To adjust the secondary transfer voltage, output chart print paper first.
1
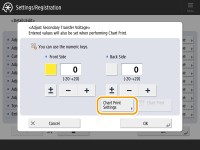
Press <Change> for <Adjust Secondary Transfer Voltage>.
2
Press <Chart Print Settings>.

3
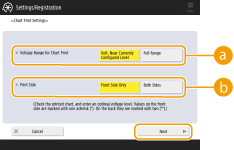
Specify the chart print settings, and press <Next>.

 <Voltage Range for Chart Print>
To perform fine adjustment, select <Volt. Near Currently Configured Level>. If major adjustment is required, select <Full Range>.

If <Volt. Near Currently Configured Level> is selected, charts are output for the range from -5 to +5 of the set voltage value.
 <Print Side>
Select the side to adjust the secondary transfer voltage for.

When <2nd Side of 2-Sided Page> is set to <On> for custom paper or paper is loaded in the multi-purpose tray and <Paper Type> is set to <2nd Side of 2-Sided Page>, select <Front Side Only>.
4
Select the paper source with the custom paper type, and press <OK>.
5
Press <Chart Print>.
The chart prints are output.

For information on the paper that can be used for chart prints when <Print Side> is set to <Both Sides>, see Paper Available for Two-Sided Copying/Two-Sided Printing.
Make sure that a sufficient supply of paper is loaded in the paper source before outputting the chart prints. The number of sheets required is indicated below.
<Voltage Range for Chart Print> | Paper in which the length of the side parallel to the feeding direction is 420 mm or longer | Paper in which the length of the side parallel to the feeding direction is shorter than 420 mm |
<Volt. Near Currently Configured Level> | 1 | 2 |
<Full Range> | 4 | 8 |
Adjusting the Secondary Transfer Voltage
You can adjust the secondary transfer voltage by visually selecting the optimal patch from the output chart.
1
Check the optimal patch from the output chart prints.
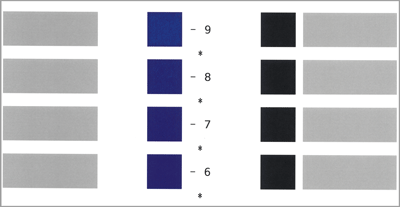
The numbers in magenta on the chart prints indicate the current settings.

Check the patches in the order from the negative values to the positive values, select the patch with density that seems even (-8 in the sample), compare it with the two patches above (-7 and -6 in the sample), and then select the optimal patch.

The single asterisk (*) printed near the value on the chart indicates the value for the front side.
If you cannot tell the difference among the selected three patches, select the one in the middle (-7 in the example).
2
Select <Front Side> or <Back Side> on the <Adjust Secondary Transfer Voltage> screen, and use <-> and <+> to enter values.

When <2nd Side of 2-Sided Page> is set to <On> for custom paper or paper is loaded in the multi-purpose tray and <Paper Type> is set to <2nd Side of 2-Sided Page>, adjust the value in <Back Side>.
See the chart print and the table below to adjust the secondary transfer voltage.
Adjustment in <-> Direction is Recommended for Following Cases | Adjustment in <+> Direction is Recommended for Following Cases | |
Paper Weight | Light (thin paper) | Heavy (thick paper) |
Poor Images | Although the density in the high density areas is normal, tiny white spots may appear in the low density areas. White spots appear in high density areas. Enough toner is not applied in high density areas, and tiny dense spots appear. Dense spots may appear in low-density areas. In high-density images, streaks of uneven density may appear along the feeding direction. | High-density parts may not be sufficiently dense. High-density images may be uneven in density. Outlines in high density images may blur. |
Poor Images (Unsmooth Paper) | In concave portions of paper with uneven surfaces (such as textured paper), the density of low-density images may be too light. | In concave portions of paper with uneven surfaces (such as textured paper), the density of high-density images may be too light. |
3
Press <OK>.